Press Releases
Euroseas Ltd. Reports Results for the Quarter Ended March 31, 2010
Maroussi, Athens, Greece - Euroseas Ltd. (NASDAQ: ESEA), an owner and operator of drybulk and container carrier vessels and provider of seaborne transportation for drybulk and containerized cargoes, announced today its results for the three month period ended March 31, 2010.
First Quarter 2010 Highlights:
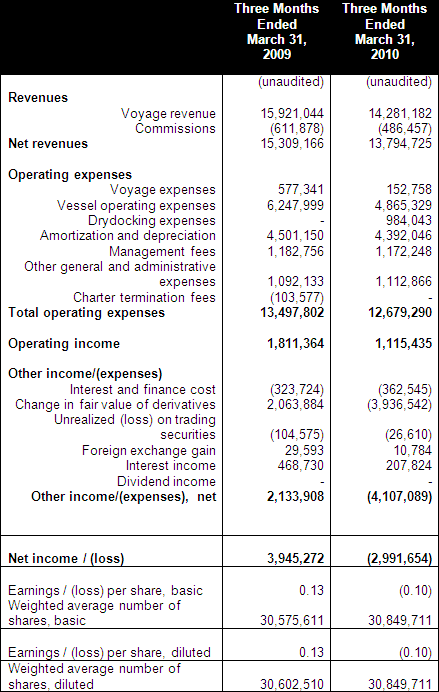
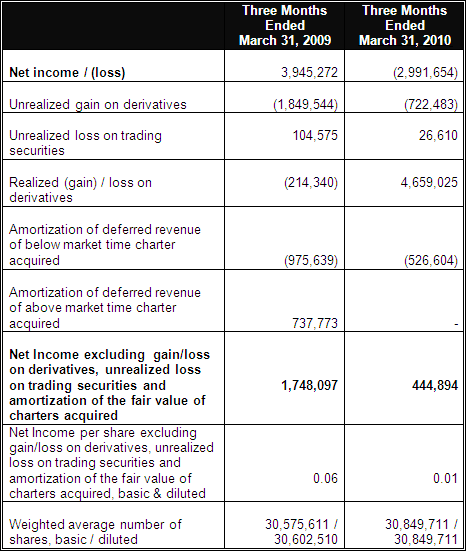
- Net loss of $3.0 million or $0.10 loss per share basic and diluted on total net revenues of $13.8 million. Excluding the effect of unrealized gain and realized losses on derivatives, unrealized loss on trading securities and amortization of the fair value of charters acquired, the earnings for the period would have been $0.4 million, or $0.01 per share.
- Adjusted EBITDA was $5.0 million. Please refer to a subsequent section of the Press Release for a reconciliation of adjusted EBITDA to net loss.
- An average of 15 vessels were owned and operated during the first quarter of 2010 earning an average time charter equivalent rate of $12,404 per day.
- Declared a quarterly dividend of $0.05 per share for the first quarter of 2010 payable on June 18, 2010 to shareholders of record on June 11, 2010. This is the nineteenth consecutive quarterly dividend declared.
Aristides Pittas, Chairman and CEO of Euroseas commented: "We concluded the first quarter of 2010 completing a joint venture with two private equity firms to jointly pursue investment opportunities in shipping. This relationship will complement our efforts and ability to identify and execute accretive transactions.
We expect to face a volatile market environment over the next one to two years especially in the drybulk market where a persistently high orderbook (even after adjusting for cancellations and slippage) is put against strong trade growth mainly coming from China and other market factors influencing demand like port congestion and longer hauls the latter also due to piracy concerns. We had covered 100% of our drybulk fleet for 2010 (either via time charter contracts or Freight Forward Agreement ("FFA") contracts) and recently increased our drybulk fleet coverage to 60% for 2011 and to about 23% for 2012.
On the containership market, we have seen signs of the market bottoming out based on the increase of rates for larger vessels and the reduction of the laid-up fleet. The size classes we operate have benefited less from rate increases and our containerships continue to face significant challenges in securing profitable employment contracts; however, we believe that our ships will soon benefit from the improving market environment and we consider it probable to re-activate our two vessels currently laid-up before the end of the year.
Our Board maintained our quarterly dividend at $0.05 per share which represents a yield of about 5.4% on the basis of our stock price on May 7, 2010."
Tasos Aslidis, Chief Financial Officer of Euroseas commented: "The results of the first quarter of 2010 reflect the lower level of the charter markets and the lower number of vessels we operated. On an operating basis, we recorded a profitable quarter despite the still challenging market environment for our containerships. However, our results were negatively influenced by losses on interest rate and FFA derivative contracts.
Specifically, the derivative contracts we entered in 2008 and 2009 to partly hedge our exposure to the charter and interest rate markets have contributed negatively to our results for the quarter. The change of the value of our derivative contracts (both realized and unrealized) amounted to a loss of $3.9 million or $0.13 per share. Without the effect of the change in value of our derivatives contracts, unrealized losses from trading securities and the amortization of the fair value of the below market charters acquired we would have recorded earnings of $0.01 per share.
Total daily vessel operating expenses, including management fees and general and administration expenses, during the first quarter of 2010 reflect a decrease of about 12.2% on a per vessel per day basis compared to the first quarter of 2009. This reduction partly reflects that two of our vessels were laid-up during the first quarter of 2010 versus one during the first quarter of 2009 and, thus, incurred significantly lower daily costs but mainly reflects our continuous effort to control our costs while ensuring safe and efficient operations. We believe that we continue to maintain one of the lowest operating cost structures amongst the public shipping companies which, we believe, is one of our competitive advantages.
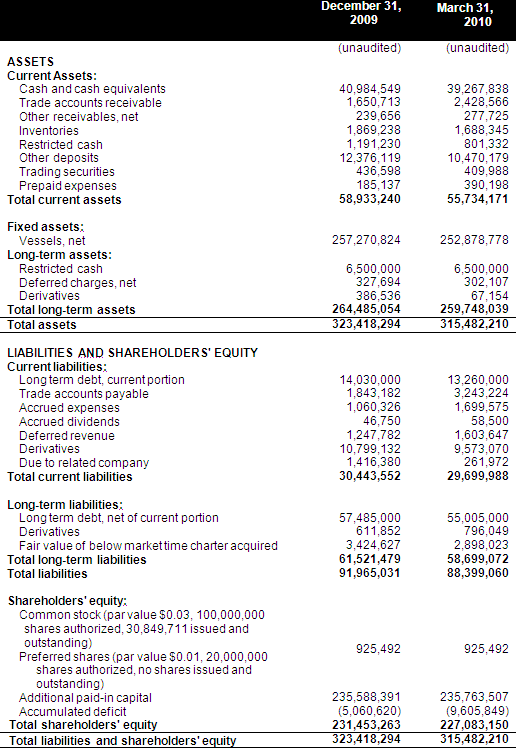
As of March 31, 2010, our outstanding debt is about $68.3 million versus restricted and unrestricted cash of about $49 million (not including cash held as margin as a result of marking-to-market our FFA contracts). We were in compliance with all our loan covenants."
First Quarter 2010 Results:
For the first quarter of 2010, the Company reported total net revenues of $13.8 million representing a 9.9% decrease over total net revenues of $15.3 million during the first quarter of 2009. The Company reported losses for the period of $3.0 million as compared to net income of $3.9 million for the first quarter of 2009. The results for the first quarter of 2010 include a $0.7 million unrealized gain on derivatives and trading securities as compared to $1.7 million unrealized gain on derivatives and trading securities for the same period of 2009; and, a $4.7 million realized loss on derivatives versus a $0.2 million realized gain in the same period of 2009. Depreciation expenses for the first quarter of 2010 were $4.4 million compared to $4.5 million during the same period of 2009. On average, 15 vessels were owned and operated during the first quarter of 2010 earning an average time charter equivalent rate of $12,404 per day compared to 15.7 vessels in the same period of 2009 earning on average $12,684 per day.
Adjusted EBITDA for the first quarter of 2010 was $5.0 million, a 17.2% decrease from $6.0 million achieved during the first quarter of 2009. Please see below for Adjusted EBITDA reconciliation to net loss and cash flow provided by operating activities.
Basic and diluted losses per share for the first quarter of 2010 was $0.10, calculated on 30,849,711 weighted average number of shares outstanding compared to basic and diluted earnings per share of $0.13 for the first quarter of 2009, calculated on 30,575,611 and 30,602,510 weighted average number of shares outstanding, respectively.
Excluding the effect on the earnings for the quarter of the unrealized gain and realized losses on derivatives, unrealized loss on trading securities and amortization of the fair value of time charter contracts acquired, the earnings per share for the quarter ended March 31, 2010 would have been $0.01 per share basic and diluted, compared to the earnings, for the quarter ended March 31, 2009 of $0.06 per share basic and diluted. Usually, security analysts do not include the above items in their published estimates of earnings per share.
Fleet Profile:
The Euroseas Ltd. fleet profile is as follows:
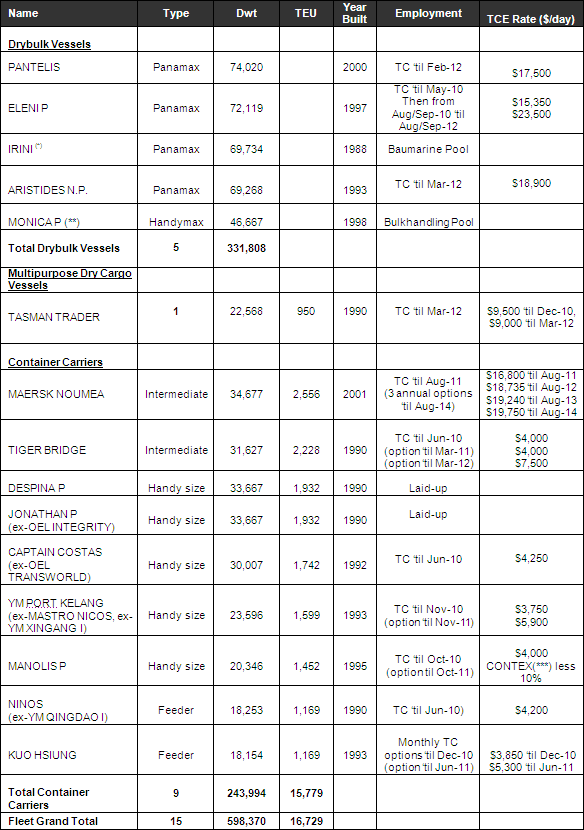
Note: TC denotes time charter. All dates listed are the earliest redelivery dates under each TC. All extension option are at the option of the charterers.
(*) "Irini" is employed in the Baumarine spot pool that is managed by Klaveness, a major global charterer in the drybulk market.
(**) "Monica P" is employed in the Bulkhandling spot pool that is also managed by Klaveness.
(***) CONTEX is a charter market index for 1700 teu containership vessels
Summary Fleet Data:
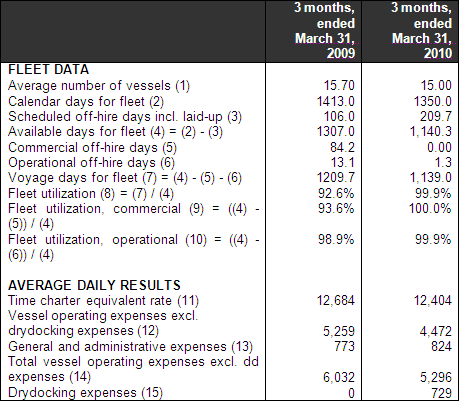
(1) Average number of vessels is the number of vessels that constituted our fleet for the relevant period, as measured by the sum of the number of calendar days each vessel was a part of our fleet during the period divided by the number of calendar days in that period.
(2) Calendar days. We define calendar days as the total number of days in a period during which each vessel in our fleet was in our possession including off-hire days associated with major repairs, drydockings or special or intermediate surveys or days of vessels in lay-up. Calendar days are an indicator of the size of our fleet over a period and affect both the amount of revenues and the amount of expenses that we record during that period.
(3) The scheduled off-hire days including vessels laid-up are days associated with scheduled repairs, drydockings or special or intermediate surveys or days of vessels in lay-up. The shipping industry uses available days to measure the number of days in a period during which vessels were available to generate revenues.
(4) Available days. We define available days as the total number of days in a period during which each vessel in our fleet was in our possession net of scheduled off-hire days including days of vessels laid-up.
(5) Commercial off-hire days. We define commercial off-hire days as days waiting to find employment.
(6) Operational off-hire days. We define operational off-hire days as days associated with unscheduled repairs or other off-hire time related to the operation of the vessels.
(7) Voyage days. We define voyage days as the total number of days in a period during which each vessel in our fleet was in our possession net of commercial and operational off-hire days. The shipping industry uses voyage days to measure the number of days in a period during which vessels actually generate revenues.
(8) Fleet utilization. We calculate fleet utilization by dividing the number of our voyage days during a period by the number of our available days during that period. The shipping industry uses fleet utilization to measure a company?s efficiency in finding suitable employment for its vessels and minimizing the amount of days that its vessels are off-hire for reasons such as unscheduled repairs or days waiting to find employment.
(9) Fleet utilization, commercial. We calculate commercial fleet utilization by dividing our available days net of commercial off-hire days during a period by our available days during that period.
(10) Fleet utilization, operational. We calculate operational fleet utilization by dividing our available net of operational off-hire days during a period by our available days during that period.
(11) Time charter equivalent, or TCE, is a measure of the average daily revenue performance of a vessel on a per voyage basis. Our method of calculating TCE is consistent with industry standards and is determined by dividing revenue generated from voyage charters net of voyage expenses by voyage days for the relevant time period. Voyage expenses primarily consist of port, canal and fuel costs that are unique to a particular voyage, which would otherwise be paid by the charterer under a time charter contract. TCE is a standard shipping industry performance measure used primarily to compare period-to-period changes in a shipping company?s performance despite changes in the mix of charter types (i.e., spot voyage charters, time charters and bareboat charters) under which the vessels may be employed between the periods.
(12) Daily vessel operating expenses, which include crew costs, provisions, deck and engine stores, lubricating oil, insurance, maintenance and repairs and management fees are calculated by dividing vessel operating expenses by fleet calendar days for the relevant time period. Drydocking expenses are reported separately.
(13) Daily general and administrative expense is calculated by dividing general and administrative expense by fleet calendar days for the relevant time period.
(14) Total vessel operating expenses, or TVOE, is a measure of our total expenses associated with operating our vessels excluding drydocking expenses. TVOE is the sum of vessel operating expenses and general and administrative expenses. Daily TVOE is calculated by dividing TVOE by fleet calendar days for the relevant time period.
(15) Drydocking expenses, which include expenses during drydockings that would been capitalized and amortized under the deferral method divided by the fleet calendar days for the relevant period. Drydocking expenses could vary substantially from period to period depending on how many vessels underwent drydocking during the period.
Conference Call and Webcast:
Tomorrow, Friday, May 14, 2010 at 8:30 a.m. EDT, the company's management will host a conference call to discuss the results.
Conference Call details:
Participants should dial into the call 10 minutes before the scheduled time using the following numbers: 1 866 819 7111 (from the US), 0800 953 0329 (from the UK) or +44 (0)1452 542 301 (international standard dial in). Please quote "Euroseas".
A replay of the conference call will be available until May 21, 2010. The United States replay number is 1(866) 247-4222; from the UK 0(800) 953-1533; the standard international replay number is (+44) (0) 1452 550 000 and the access code required for the replay is: 6973591#.
Audio webcast - Slides Presentation:
There will be a live and then archived audio webcast of the conference call, via the internet through the Euroseas website (www.euroseas.gr). Participants to the live webcast should register on the website approximately 10 minutes prior to the start of the webcast. A slide presentation on the First Quarter 2010 results in PDF format will also be available 30 minutes prior to the conference call and webcast accessible on the company's website (www.euroseas.gr) on the webcast page. Participants to the webcast can download the PDF presentation.
Consolidated Condensed Statements of Operations
(All amounts expressed in U.S. Dollars except number of shares)
Euroseas Ltd.
Consolidated Condensed Balance Sheets
(All amounts expressed in U.S. Dollars ? except number of shares)
Euroseas Ltd.
Consolidated Condensed Statements of Cash Flows
(All amounts expressed in U.S. Dollars)
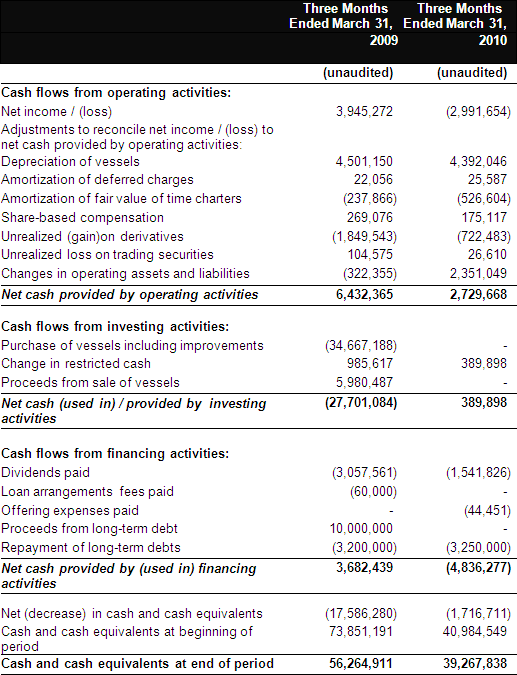
Euroseas Ltd.
Reconciliation of Adjusted EBITDA to
Net Income / (loss) and Cash Flow Provided By Operating Activities
(All amounts expressed in U.S. Dollars)
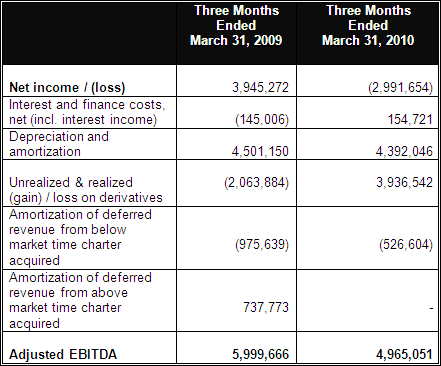
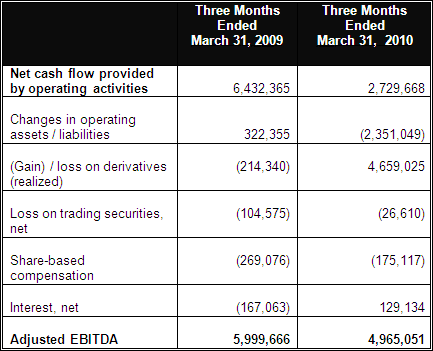
EBITDA Reconciliation:
Euroseas Ltd. considers Adjusted EBITDA to represent net earnings / loss before interest, income taxes, depreciation, amortization, gain / loss on derivatives and amortization of deferred revenue from above or below market time charters acquired. Adjusted EBITDA does not represent and should not be considered as an alternative to net income / loss or cash flow from operations, as determined by United States generally accepted accounting principles, or U.S. GAAP, and our calculation of Adjusted EBITDA may not be comparable to that reported by other companies. Adjusted EBITDA is included herein because it is a basis upon which we assess our financial performance and liquidity position and because we believe that it presents useful information to investors regarding a company's ability to service and/or incur indebtedness. The Company's definition of Adjusted EBITDA may not be the same as that used by other companies in the shipping or other industries.
Euroseas Ltd.
Reconciliation of Net Income Excluding the Effect from Gain/Loss on derivatives,
Unrealized Loss on trading securities and
Amortization of the Fair Value of Charters Acquired to Net Income / (Loss)
(All amounts expressed in U.S. Dollars except number of shares)
About Euroseas Ltd.
Euroseas Ltd. was formed on May 5, 2005 under the laws of the Republic of the Marshall Islands to consolidate the ship owning interests of the Pittas family of Athens, Greece, which has been in the shipping business over the past 136 years. Euroseas trades on the NASDAQ Global Select Market under the ticker ESEA.
Euroseas operates in the dry cargo, drybulk and container shipping markets. Euroseas' operations are managed by Eurobulk Ltd., an ISO 9001:2000 certified affiliated ship management company, which is responsible for the day-to-day commercial and technical management and operations of the vessels. Euroseas employs its vessels on spot and period charters and through pool arrangements.
The Company has a fleet of 15 vessels, including 4 Panamax drybulk carriers and 1 Handymax drybulk carrier, 2 Intermediate containership, 5 Handysize containerships, 2 Feeder containerships and a multipurpose dry cargo vessel. Euroseas` 5 drybulk carriers have a total cargo capacity of 331,808 dwt, its 9 containerships have a cargo capacity of 15,779 teu and its multipurpose vessel has a cargo capacity of 22,568 dwt or 950 teu.
Forward Looking Statement
This press release contains forward-looking statements (as defined in Section 27A of the Securities Act of 1933, as amended, and Section 21E of the Securities Exchange Act of 1934, as amended) concerning future events and the Company's growth strategy and measures to implement such strategy; including our expected joint venture and vessel acquisitions and time charters. Words such as "expects," "intends," "plans," "believes," "anticipates," "hopes," "estimates," and variations of such words and similar expressions are intended to identify forward-looking statements. Although the Company believes that the expectations reflected in such forward-looking statements are reasonable, no assurance can be given that such expectations will prove to have been correct. These statements involve known and unknown risks and are based upon a number of assumptions and estimates that are inherently subject to significant uncertainties and contingencies, many of which are beyond the control of the Company. Actual results may differ materially from those expressed or implied by such forward-looking statements. Factors that could cause actual results to differ materially include, but are not limited to changes in the demand for drybulk vessels and containerships, competitive factors in the market in which the Company operates; risks associated with operations outside the United States; and other factors listed from time to time in the Company's filings with the Securities and Exchange Commission. The Company expressly disclaims any obligations or undertaking to release publicly any updates or revisions to any forward-looking statements contained herein to reflect any change in the Company's expectations with respect thereto or any change in events, conditions or circumstances on which any statement is based.
Visit our website www.euroseas.gr
Company Contact
Tasos Aslidis
Chief Financial Officer
Euroseas Ltd.
11 Canterbury Lane,
Watchung, NJ 07069
Tel. (908) 301-9091
E-mail: aha@euroseas.gr
Investor Relations / Financial Media
Nicolas Bornozis
President
Capital Link, Inc.
230 Park Avenue, Suite 1536
New York, NY 10169
Tel. (212) 661-7566
E-mail: nbornozis@capitallink.com